> ## Documentation Index
> Fetch the complete documentation index at: https://docs.chartcastr.com/llms.txt
> Use this file to discover all available pages before exploring further.
# Microsoft Clarity source
> Connect Microsoft Clarity to Chartcastr for automated behavioural analytics charts — sessions, scroll depth, engagement time, rage clicks, dead clicks — delivered to Slack or email.
## Overview
Use Microsoft Clarity as a data source for Chartcastr. Connect your Clarity project with an API token and Chartcastr will pull aggregate metrics — sessions, scroll depth, engagement time, rage clicks, dead clicks — and turn them into charts delivered to Slack or email.
Clarity is a free behavioural analytics tool from Microsoft. **Chartcastr only reads the aggregate Data Export API metrics — never session recordings or heatmaps.**
**Clarity API has unusual limits.** The Data Export API caps each project at **10 requests per day** and returns one aggregated row per call (window of 1, 2, or 3 days) — there is no historical/backfill endpoint and no per-day breakdown. Chartcastr fetches yesterday's data on connect, then pulls one snapshot per day at **midnight in your organisation's timezone** and accumulates history in our database. **Your 30-day chart fills in one day at a time over the first month after connecting.**
## Setup
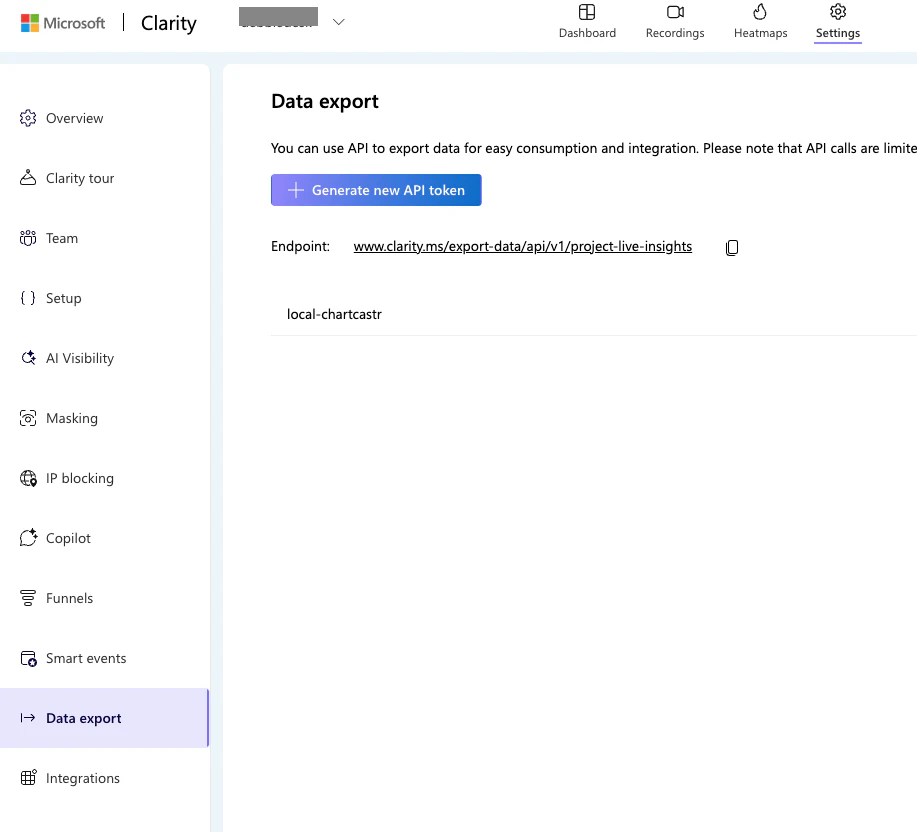
In Clarity, go to **Settings → Data Export → Generate new API token** ([clarity.microsoft.com](https://clarity.microsoft.com/)). Copy the JWT token — you'll need it in the next step.
Each Clarity project has its own token. Connect one Chartcastr source per Clarity project.
 In Chartcastr, go to **New Source** and select **Microsoft Clarity**. Paste your API token and optionally enter a friendly project label (e.g. `example.com production`). Click **Test & Connect** to validate.
On first connect Chartcastr immediately fetches yesterday's data so you see one real data point right away. Future snapshots run daily at midnight in your organisation's timezone (configurable in **Settings → Organization**, defaults to UTC).
Choose which Clarity metric to track. Each metric becomes its own source. You can add multiple sources to send different charts on different schedules.
Pick or add a destination (Slack channel or email), set the delivery frequency, and optionally enable AI summaries.
## Available Metrics
Chartcastr exposes **19 pre-built Clarity metrics** across four categories.
Sessions, distinct users, and bot sessions per day.
Pages per session, active engagement time, and scroll depth per day.
Rage clicks, dead clicks, excessive scroll, and quickback clicks per day. UX bug detectors that other analytics tools don't surface.
Top pages (by sessions, rage clicks, or scroll depth), top browsers, devices, countries, OSes, traffic sources, and channels.
## How charts accumulate over time
Because Clarity only returns one aggregated row per call (over a 1–3 day window), Chartcastr cannot fetch a real 30-day, day-by-day chart on demand. Instead:
1. **On connect**, Chartcastr fetches yesterday's data across all 7 fetch groups so the chart has one real data point straight away. We deliberately don't pull a wider window on connect — a 3-day call would land as one inflated point, not three days of history.
2. **At midnight in your organisation's timezone**, Chartcastr's daily job pulls yesterday's data across the same 7 fetch groups (overall site totals + breakdowns by URL, browser, device, country, OS, and traffic source). The schedule honours the timezone in **Settings → Organization** (defaults to UTC).
3. **Each daily pull uses 7 of your project's 10 API requests** — leaving headroom for manual refreshes.
4. **Charts read from the accumulated snapshots in our database**, not the Clarity API. This is why a 30-day chart shows fewer days when you first connect, and fills in to its full window over the first month.
You can manually trigger a refresh from **Settings → Source Integrations**, but heavy use of "Refresh now" can exhaust your daily quota — Clarity will return 429 errors for the rest of the day and Chartcastr will skip that project until your next local midnight.
## Privacy
Chartcastr **only** reads the aggregate Data Export API. We do not access:
* Session recordings or replays
* Heatmaps
* Individual user data
The Data Export API returns aggregate counts and dimensional labels — no PII.
## API reference
Microsoft Clarity Data Export API documentation: [learn.microsoft.com/en-us/clarity/setup-and-installation/clarity-data-export-api](https://learn.microsoft.com/en-us/clarity/setup-and-installation/clarity-data-export-api).
## Next Steps
Deliver Clarity charts (with AI summaries) to your Slack channels.
Schedule Clarity behavioural reports to any inbox.
In Chartcastr, go to **New Source** and select **Microsoft Clarity**. Paste your API token and optionally enter a friendly project label (e.g. `example.com production`). Click **Test & Connect** to validate.
On first connect Chartcastr immediately fetches yesterday's data so you see one real data point right away. Future snapshots run daily at midnight in your organisation's timezone (configurable in **Settings → Organization**, defaults to UTC).
Choose which Clarity metric to track. Each metric becomes its own source. You can add multiple sources to send different charts on different schedules.
Pick or add a destination (Slack channel or email), set the delivery frequency, and optionally enable AI summaries.
## Available Metrics
Chartcastr exposes **19 pre-built Clarity metrics** across four categories.
Sessions, distinct users, and bot sessions per day.
Pages per session, active engagement time, and scroll depth per day.
Rage clicks, dead clicks, excessive scroll, and quickback clicks per day. UX bug detectors that other analytics tools don't surface.
Top pages (by sessions, rage clicks, or scroll depth), top browsers, devices, countries, OSes, traffic sources, and channels.
## How charts accumulate over time
Because Clarity only returns one aggregated row per call (over a 1–3 day window), Chartcastr cannot fetch a real 30-day, day-by-day chart on demand. Instead:
1. **On connect**, Chartcastr fetches yesterday's data across all 7 fetch groups so the chart has one real data point straight away. We deliberately don't pull a wider window on connect — a 3-day call would land as one inflated point, not three days of history.
2. **At midnight in your organisation's timezone**, Chartcastr's daily job pulls yesterday's data across the same 7 fetch groups (overall site totals + breakdowns by URL, browser, device, country, OS, and traffic source). The schedule honours the timezone in **Settings → Organization** (defaults to UTC).
3. **Each daily pull uses 7 of your project's 10 API requests** — leaving headroom for manual refreshes.
4. **Charts read from the accumulated snapshots in our database**, not the Clarity API. This is why a 30-day chart shows fewer days when you first connect, and fills in to its full window over the first month.
You can manually trigger a refresh from **Settings → Source Integrations**, but heavy use of "Refresh now" can exhaust your daily quota — Clarity will return 429 errors for the rest of the day and Chartcastr will skip that project until your next local midnight.
## Privacy
Chartcastr **only** reads the aggregate Data Export API. We do not access:
* Session recordings or replays
* Heatmaps
* Individual user data
The Data Export API returns aggregate counts and dimensional labels — no PII.
## API reference
Microsoft Clarity Data Export API documentation: [learn.microsoft.com/en-us/clarity/setup-and-installation/clarity-data-export-api](https://learn.microsoft.com/en-us/clarity/setup-and-installation/clarity-data-export-api).
## Next Steps
Deliver Clarity charts (with AI summaries) to your Slack channels.
Schedule Clarity behavioural reports to any inbox.