> ## Documentation Index
> Fetch the complete documentation index at: https://docs.chartcastr.com/llms.txt
> Use this file to discover all available pages before exploring further.
# Grafana source
> Connect Grafana to Chartcastr and pulse any PromQL, SQL, or Loki metric to Slack or email — line or bar chart, with optional split Y-axis.
## Overview
Use Grafana as a data source for Chartcastr. Connect your Grafana host (self-hosted or Grafana Cloud) with a service-account token and Chartcastr will execute queries against your existing datasources — Prometheus, Loki, MySQL, Postgres, InfluxDB, and more — and chart the result.
Each Chartcastr source can pulse **up to two metrics** rendered as a line or bar chart. When two metrics have very different scales (say request rate at 5,000/s and error percentage at 0–5%), flip on the **split Y-axis** option to keep both legible.
Grafana metrics are user-defined — there is no preset metric list like Plausible or PostHog. You supply the query expression that Grafana itself would run.
## Setup
In your Grafana Cloud stack, go to **Administration → Users and access → Service accounts**. You can find it quickly by pressing `Cmd+K` (or `Ctrl+K`) and searching for "service".
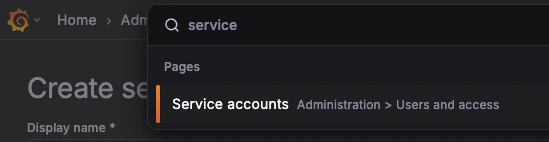 Click **Add service account**, give it a name (e.g. `chartcastr-integration`), and set the role to **Viewer**. Viewer access is all Chartcastr needs — it only reads metric data.
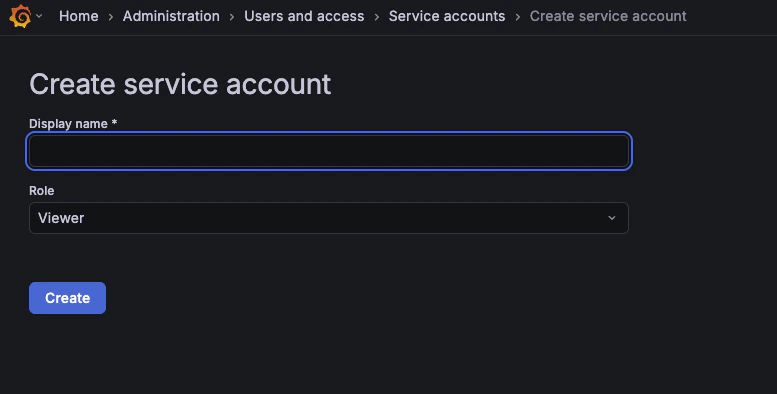 In your Grafana instance, go to **Administration → Users and access → Service accounts**. You can find it quickly by pressing `Cmd+K` (or `Ctrl+K`) and searching for "service".
Click **Add service account**, give it a name (e.g. `chartcastr-integration`), and set the role to **Viewer**. Viewer access is all Chartcastr needs — it only reads metric data.
Service accounts require **Grafana 8.5 or later**. If you're on an older version, upgrade before proceeding or use a basic-auth API key instead (contact support).
Click into the service account you just created, then click **Add service account token**.
In your Grafana instance, go to **Administration → Users and access → Service accounts**. You can find it quickly by pressing `Cmd+K` (or `Ctrl+K`) and searching for "service".
Click **Add service account**, give it a name (e.g. `chartcastr-integration`), and set the role to **Viewer**. Viewer access is all Chartcastr needs — it only reads metric data.
Service accounts require **Grafana 8.5 or later**. If you're on an older version, upgrade before proceeding or use a basic-auth API key instead (contact support).
Click into the service account you just created, then click **Add service account token**.
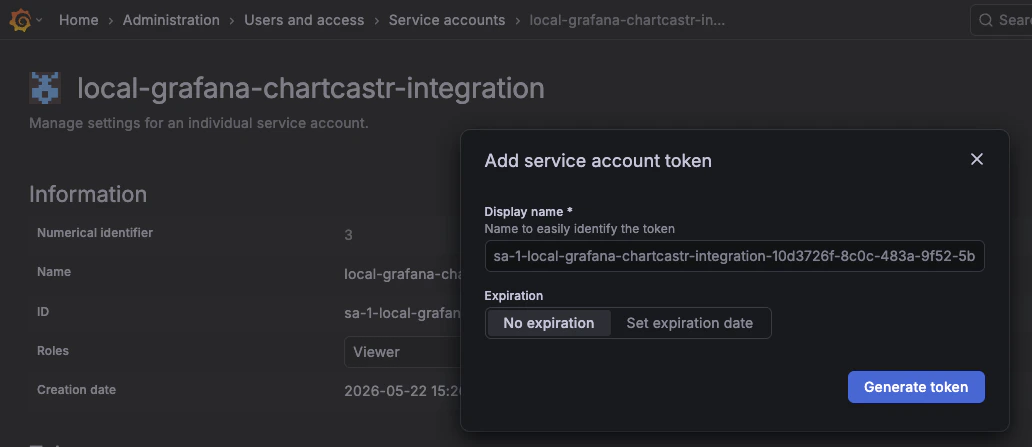 Give the token a display name and set an **expiration date**. We recommend **1 year** — long enough to avoid frequent rotation, short enough to limit exposure if the token is ever compromised. Copy the generated `glsa_...` token; you won't be able to view it again.
Store the token somewhere safe before closing the dialog. Grafana only shows it once.
In Chartcastr, go to **New Source** and select **Grafana**. Enter:
* **Grafana host** — the full URL of your Grafana instance
Your Grafana Cloud URL looks like `https://yourorg.grafana.net`. Find it in the Grafana Cloud portal under your stack details.
Use the URL your team browses to — e.g. `https://grafana.example.com` or `http://localhost:3000` for local setups. Make sure the host is reachable from the internet (Chartcastr's servers need to reach it).
* **Service account token** — the `glsa_...` token from the previous step
Click **Test & Connect** to validate the connection.
Chartcastr loads the list of datasources available to your service account. Pick the one your metric lives in (Prometheus, Loki, your SQL database, etc.).
Paste the query expression for your metric — PromQL for Prometheus, LogQL for Loki, raw SQL for SQL datasources. Add an optional label to use in the legend.
Example PromQL:
```promql theme={null}
sum(rate(http_requests_total{job="api"}[5m]))
```
Example LogQL:
```logql theme={null}
sum(count_over_time({app="api"} |= "ERROR"[5m]))
```
Click **Add second metric** to overlay a second series on the same chart. If the two metrics have very different ranges, enable **Split Y-axis** so each gets its own scale.
Choose **Line** or **Bar**, then pick how far back to look (1 hour, 6 hours, 24 hours, 7 days, or 30 days).
Click **Preview chart** to see what the rendered chart looks like with live data. Save the source, then create a connection to your Slack channel or email destination.
## Supported datasource types
Chartcastr's Grafana integration runs queries via Grafana's `/api/ds/query` endpoint, which supports any datasource installed in your Grafana — including:
* **Prometheus** (PromQL)
* **Loki** (LogQL)
* **MySQL / Postgres / MSSQL** (SQL)
* **InfluxDB** (InfluxQL / Flux)
* **ClickHouse**
* Any community datasource plugin that accepts a `query` field
## Notes
* **Only integer metrics**: values are rounded to integers. This is fine for counts and rates but means decimal-precision metrics (e.g. 0.823 ratios) will lose precision.
* **Time-series only**: queries must return a time-series shape. Single-value (instant) queries are not yet supported.
* **Service-account token is encrypted**: stored AES-256-GCM-encrypted at rest, never exposed back to the client.
* **Self-hosted reachability**: Chartcastr's servers must be able to reach your Grafana host over HTTPS. If your Grafana is behind a private network or VPN, use Grafana Cloud or expose it via a reverse proxy with a valid TLS certificate.
Give the token a display name and set an **expiration date**. We recommend **1 year** — long enough to avoid frequent rotation, short enough to limit exposure if the token is ever compromised. Copy the generated `glsa_...` token; you won't be able to view it again.
Store the token somewhere safe before closing the dialog. Grafana only shows it once.
In Chartcastr, go to **New Source** and select **Grafana**. Enter:
* **Grafana host** — the full URL of your Grafana instance
Your Grafana Cloud URL looks like `https://yourorg.grafana.net`. Find it in the Grafana Cloud portal under your stack details.
Use the URL your team browses to — e.g. `https://grafana.example.com` or `http://localhost:3000` for local setups. Make sure the host is reachable from the internet (Chartcastr's servers need to reach it).
* **Service account token** — the `glsa_...` token from the previous step
Click **Test & Connect** to validate the connection.
Chartcastr loads the list of datasources available to your service account. Pick the one your metric lives in (Prometheus, Loki, your SQL database, etc.).
Paste the query expression for your metric — PromQL for Prometheus, LogQL for Loki, raw SQL for SQL datasources. Add an optional label to use in the legend.
Example PromQL:
```promql theme={null}
sum(rate(http_requests_total{job="api"}[5m]))
```
Example LogQL:
```logql theme={null}
sum(count_over_time({app="api"} |= "ERROR"[5m]))
```
Click **Add second metric** to overlay a second series on the same chart. If the two metrics have very different ranges, enable **Split Y-axis** so each gets its own scale.
Choose **Line** or **Bar**, then pick how far back to look (1 hour, 6 hours, 24 hours, 7 days, or 30 days).
Click **Preview chart** to see what the rendered chart looks like with live data. Save the source, then create a connection to your Slack channel or email destination.
## Supported datasource types
Chartcastr's Grafana integration runs queries via Grafana's `/api/ds/query` endpoint, which supports any datasource installed in your Grafana — including:
* **Prometheus** (PromQL)
* **Loki** (LogQL)
* **MySQL / Postgres / MSSQL** (SQL)
* **InfluxDB** (InfluxQL / Flux)
* **ClickHouse**
* Any community datasource plugin that accepts a `query` field
## Notes
* **Only integer metrics**: values are rounded to integers. This is fine for counts and rates but means decimal-precision metrics (e.g. 0.823 ratios) will lose precision.
* **Time-series only**: queries must return a time-series shape. Single-value (instant) queries are not yet supported.
* **Service-account token is encrypted**: stored AES-256-GCM-encrypted at rest, never exposed back to the client.
* **Self-hosted reachability**: Chartcastr's servers must be able to reach your Grafana host over HTTPS. If your Grafana is behind a private network or VPN, use Grafana Cloud or expose it via a reverse proxy with a valid TLS certificate.