> ## Documentation Index
> Fetch the complete documentation index at: https://docs.chartcastr.com/llms.txt
> Use this file to discover all available pages before exploring further.
# HubSpot CRM source
> Connect HubSpot CRM to Chartcastr for automated charts of your sales pipeline, deal stages, contact lifecycle, and revenue. Setup guide included.
## Overview
Chartcastr connects to your HubSpot portal to pull CRM metrics — pipeline health, deal velocity, revenue forecasts, lifecycle funnels, and more — and delivers them as automated charts to Slack or email with AI-powered analysis.
Chartcastr connects with **read-only** access to your HubSpot portal. No write permissions are requested, and no CRM data is stored between runs.
HubSpot integration is available on **all paid plans**. [See pricing](https://chartcastr.com/pricing) or [sign up](https://chartcastr.com/sign-up) to get started.
## Install & Connect
[Sign up](https://chartcastr.com/sign-up) with your Google account, then start a Starter or Pro trial to unlock premium integrations including HubSpot.
Go to [Settings → Source Integrations](https://chartcastr.com/admin/settings/source/integrations) and find **HubSpot CRM**.
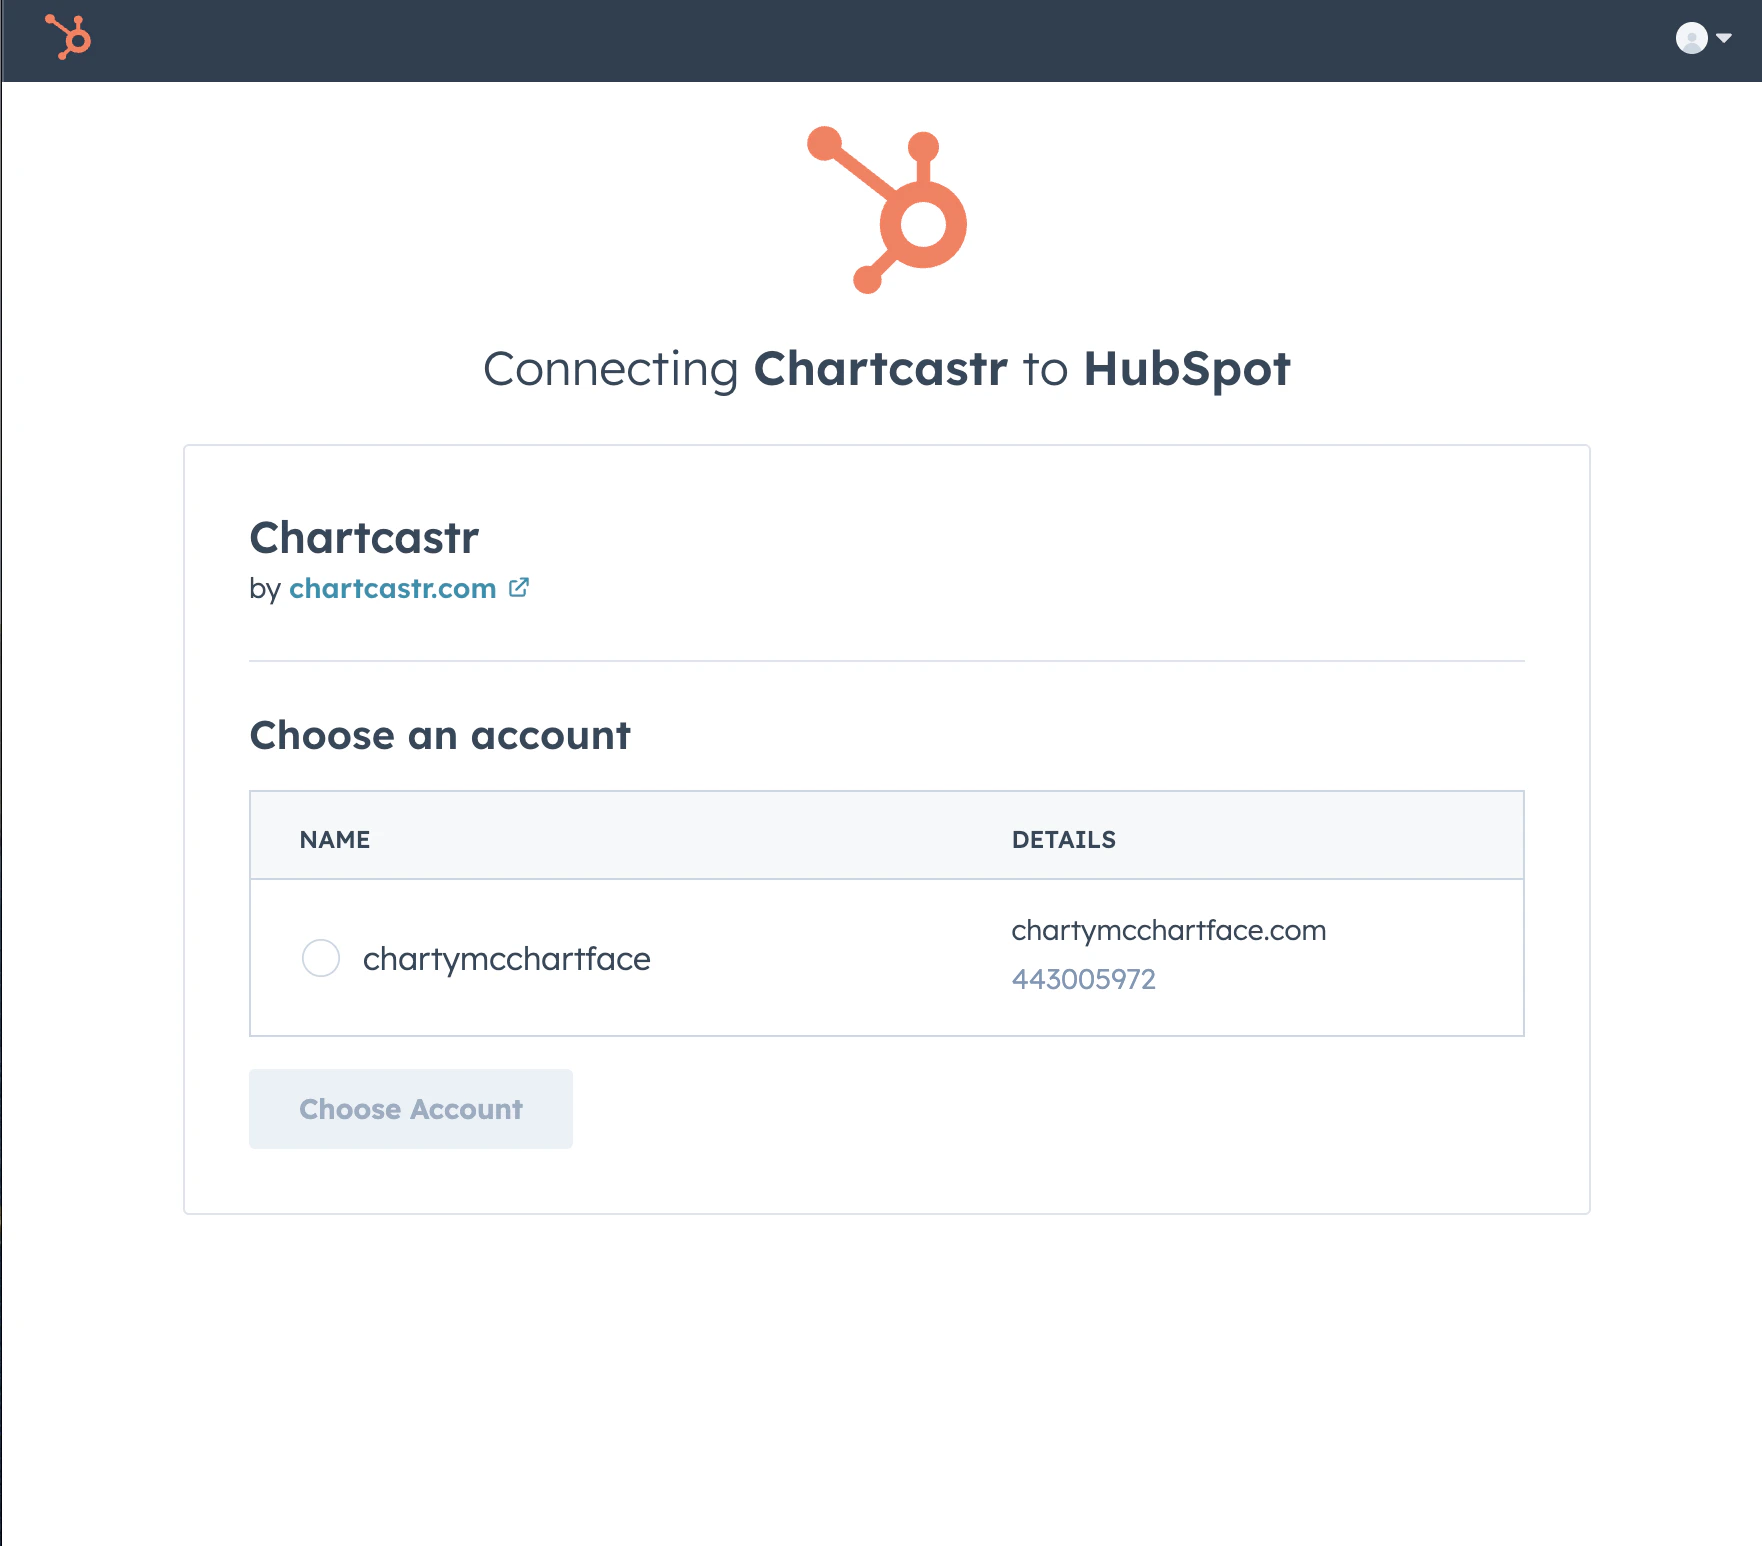
Click **Connect** and complete the OAuth flow. You will be redirected to HubSpot to select which account to connect.
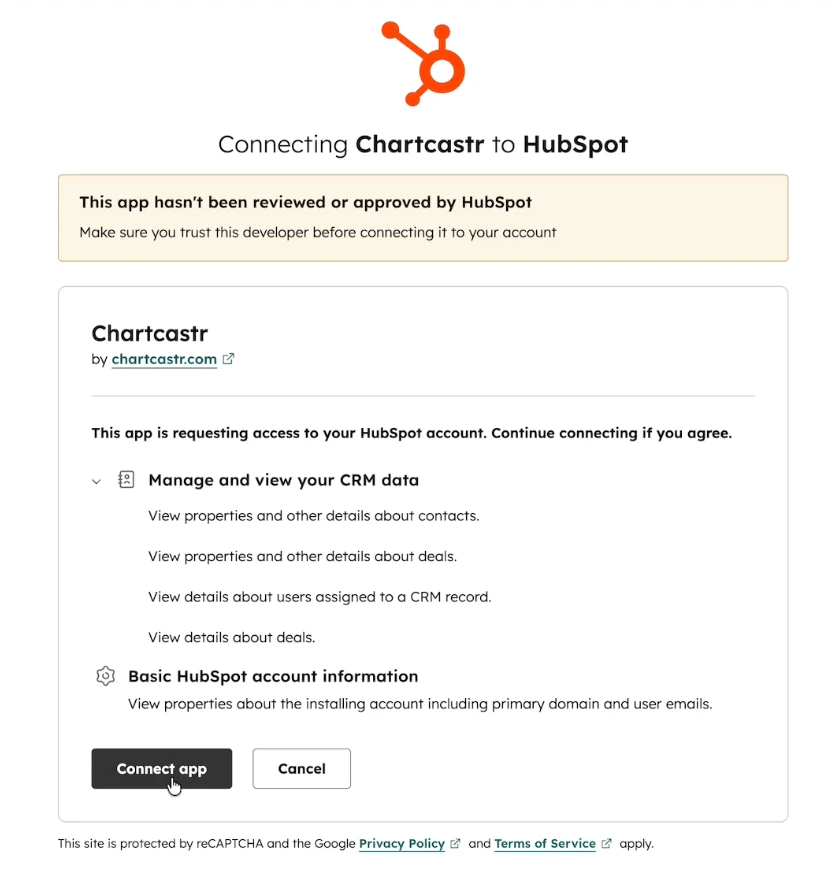
After selecting your account, review the requested permissions and click **Connect app**.
After authorizing, you'll be redirected back to Chartcastr. The integration status will show as **Active**.
## Configure a HubSpot Source
Once connected, you can create chart sources from your HubSpot data.
Go to [Connections](https://chartcastr.com/admin/connections) and click **New Connection**. Select **HubSpot CRM** as your source type.
Browse the available metrics organized by category (Pipeline, Contacts, Revenue). Select the metric you want to track — a live preview of your data will appear inline.
Select where you want your chart delivered:
* **Email** — quickest way to get started, delivered to your inbox
* **Slack** — post charts directly to a team channel with AI summaries and interactive follow-up questions
Configure how often you'd like to receive your pulse (daily, weekly, etc.) and save. Chartcastr will automatically generate and deliver AI-analyzed charts on your schedule.
You can add multiple HubSpot sources to send different metrics on different schedules. A common setup is a **Pipeline Summary** every Monday morning to Slack, plus a **Closed-Won Revenue** chart weekly to the leadership email group.
## Use the App
Once a connection is created, Chartcastr works automatically:
* **Scheduled delivery** — Charts are generated and delivered on your configured schedule. Data is fetched fresh from HubSpot every time a pulse fires.
* **AI-powered analysis** — Every chart comes with an AI-generated summary tailored to the specific CRM metric, highlighting trends, anomalies, and actionable insights.
* **Follow-up questions** — In Slack, you can ask follow-up questions about your chart directly in the thread. The AI uses your chart data as context to answer.
* **Manual triggers** — You can trigger any pulse on-demand from the [Connections](https://chartcastr.com/admin/connections) page without waiting for the next scheduled run.
No manual actions are required for ongoing use. Charts are generated and delivered automatically.
## Available Charts
Chartcastr supports **10 pre-built HubSpot metrics** across three categories, designed for RevOps and sales leaders.
### Pipeline & Deals
| Metric | Chart Type | Description |
| ------------------------------ | ----------------- | ------------------------------------------------------ |
| **Pipeline Summary** | Combo (dual axis) | Deal count and total value by pipeline stage |
| **Deals Created Over Time** | Line | Weekly trend of new deals entering the pipeline |
| **Closed-Won Revenue** | Bar | Weekly closed-won deal revenue |
| **Deal Velocity by Stage** | Bar | Average days deals spend in each pipeline stage |
| **Weighted Pipeline Forecast** | Combo | Weighted deal value by stage probability vs closed-won |
| **Top Deal Loss Reasons** | Bar | Most common reasons deals are lost |
### Contacts & Lifecycle
| Metric | Chart Type | Description |
| -------------------------- | ---------- | --------------------------------------------------------------------------- |
| **Lifecycle Stage Funnel** | Bar | Contact count by lifecycle stage (Subscriber → Lead → MQL → SQL → Customer) |
| **New Contacts Over Time** | Line | Weekly new contacts created |
### Revenue Attribution
| Metric | Chart Type | Description |
| --------------------------- | ----------- | ----------------------------------------------- |
| **Revenue by Deal Owner** | Bar | Closed-won revenue attributed to each sales rep |
| **Pipeline Stage Movement** | Stacked Bar | Deal value entering each stage over time |
See the full list with AI analysis examples and recommended use cases.
## Data & Permissions
Chartcastr requests the following HubSpot OAuth scopes — all **read-only**:
| Scope | Purpose |
| --------------------------- | ---------------------------------------------------- |
| `crm.objects.deals.read` | Read deal records (amount, stage, close date, owner) |
| `crm.objects.contacts.read` | Read contact records (lifecycle stage, create date) |
| `crm.schemas.deals.read` | Read deal pipeline and stage definitions |
| `crm.objects.owners.read` | Read owner/rep names for revenue attribution |
| `oauth` | Required base scope for OAuth flow |
### What data does Chartcastr access?
* **Deals**: Deal name, amount, stage, pipeline, create date, close date, owner, loss reason, and stage probability.
* **Contacts**: Lifecycle stage and create date.
* **Pipelines**: Pipeline names, stage names, display order, and probability metadata.
* **Owners**: First name, last name, and email for deal attribution.
Chartcastr does **not** access or store emails, notes, call recordings, or any engagement data. Data is fetched on-demand when a pulse fires and is not cached between runs.
## Disconnect from Chartcastr
To disconnect your HubSpot portal from Chartcastr:
1. Go to [Settings → Source Integrations](https://chartcastr.com/admin/settings/source/integrations).
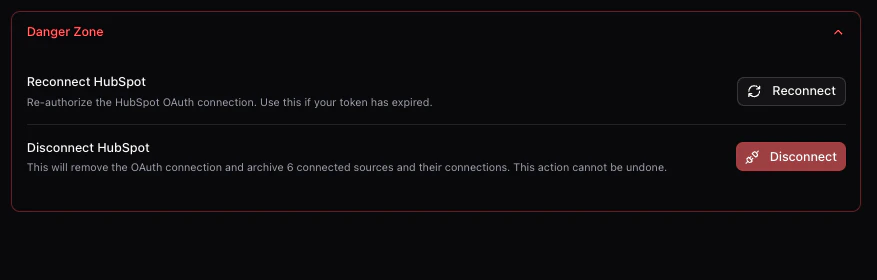
2. Find **HubSpot CRM** and click **Disconnect**.
3. Confirm the disconnection.
### What happens when you disconnect
* **Scheduled pulses stop** — Any connections using HubSpot sources will stop delivering. The connections remain configured but will show an error status until reconnected.
* **Existing charts are preserved** — Charts and AI summaries that have already been delivered to Slack or email remain in those destinations. Nothing is deleted retroactively.
* **No data is retained** — Chartcastr does not store your HubSpot CRM data between pulse runs, so there is no data to clean up on our side.
* **You can reconnect at any time** — Re-authorizing via OAuth will restore your existing connections and resume scheduled deliveries.
## Uninstall from HubSpot
To fully remove Chartcastr from your HubSpot portal, follow the steps in [HubSpot's guide to disconnecting apps](https://knowledge.hubspot.com/integrations/connect-apps-to-hubspot). This revokes Chartcastr's OAuth tokens and removes the app from your HubSpot Connected Apps list.
Uninstalling from HubSpot has the same consequences as disconnecting from Chartcastr (above). No CRM data is retained by Chartcastr, and previously delivered charts remain in your Slack channels and email inboxes.
## FAQ
HubSpot OAuth grants access to a single portal per connection. If you have multiple HubSpot portals, you can connect each one separately by repeating the OAuth flow.
By default, Chartcastr uses your **default deal pipeline** (the first pipeline returned by HubSpot). Support for selecting specific pipelines is coming soon.
Data is fetched fresh from HubSpot every time a pulse fires. Chartcastr does not cache or store your CRM data between runs.
Time-series metrics (deals over time, contacts over time, etc.) use the last 12 weeks of data by default.
No. Chartcastr fetches data on-demand when a pulse fires, generates the chart and AI summary, delivers it to your destination, and discards the raw CRM data. Only the rendered chart image and summary text are retained as part of the pulse delivery history.
## Next Steps
Send HubSpot charts to Slack channels with AI summaries and follow-up questions.
Email HubSpot charts with AI-powered analysis on a schedule.
 After selecting your account, review the requested permissions and click **Connect app**.
 After authorizing, you'll be redirected back to Chartcastr. The integration status will show as **Active**.
 ### What happens when you disconnect
* **Scheduled pulses stop** — Any connections using HubSpot sources will stop delivering. The connections remain configured but will show an error status until reconnected.
* **Existing charts are preserved** — Charts and AI summaries that have already been delivered to Slack or email remain in those destinations. Nothing is deleted retroactively.
* **No data is retained** — Chartcastr does not store your HubSpot CRM data between pulse runs, so there is no data to clean up on our side.
* **You can reconnect at any time** — Re-authorizing via OAuth will restore your existing connections and resume scheduled deliveries.
## Uninstall from HubSpot
To fully remove Chartcastr from your HubSpot portal, follow the steps in [HubSpot's guide to disconnecting apps](https://knowledge.hubspot.com/integrations/connect-apps-to-hubspot). This revokes Chartcastr's OAuth tokens and removes the app from your HubSpot Connected Apps list.
Uninstalling from HubSpot has the same consequences as disconnecting from Chartcastr (above). No CRM data is retained by Chartcastr, and previously delivered charts remain in your Slack channels and email inboxes.
## FAQ
### What happens when you disconnect
* **Scheduled pulses stop** — Any connections using HubSpot sources will stop delivering. The connections remain configured but will show an error status until reconnected.
* **Existing charts are preserved** — Charts and AI summaries that have already been delivered to Slack or email remain in those destinations. Nothing is deleted retroactively.
* **No data is retained** — Chartcastr does not store your HubSpot CRM data between pulse runs, so there is no data to clean up on our side.
* **You can reconnect at any time** — Re-authorizing via OAuth will restore your existing connections and resume scheduled deliveries.
## Uninstall from HubSpot
To fully remove Chartcastr from your HubSpot portal, follow the steps in [HubSpot's guide to disconnecting apps](https://knowledge.hubspot.com/integrations/connect-apps-to-hubspot). This revokes Chartcastr's OAuth tokens and removes the app from your HubSpot Connected Apps list.
Uninstalling from HubSpot has the same consequences as disconnecting from Chartcastr (above). No CRM data is retained by Chartcastr, and previously delivered charts remain in your Slack channels and email inboxes.
## FAQ