> ## Documentation Index
> Fetch the complete documentation index at: https://docs.chartcastr.com/llms.txt
> Use this file to discover all available pages before exploring further.
# Savio source
> Connect Savio to Chartcastr for automated product-feedback charts. Track feedback volume, top feature requests, customer-type breakdowns, and more.
## Overview
Use [Savio](https://www.savio.io) as a data source for Chartcastr. Savio centralises customer feedback and feature requests from Slack, HubSpot, Intercom, Zendesk, Salesforce, Help Scout, and other tools. Chartcastr pulls feedback, feature-request, contact, and company data from the Savio API and renders scheduled charts to Slack or email.
Chartcastr connects with read-only access using a per-account API token.
## Setup
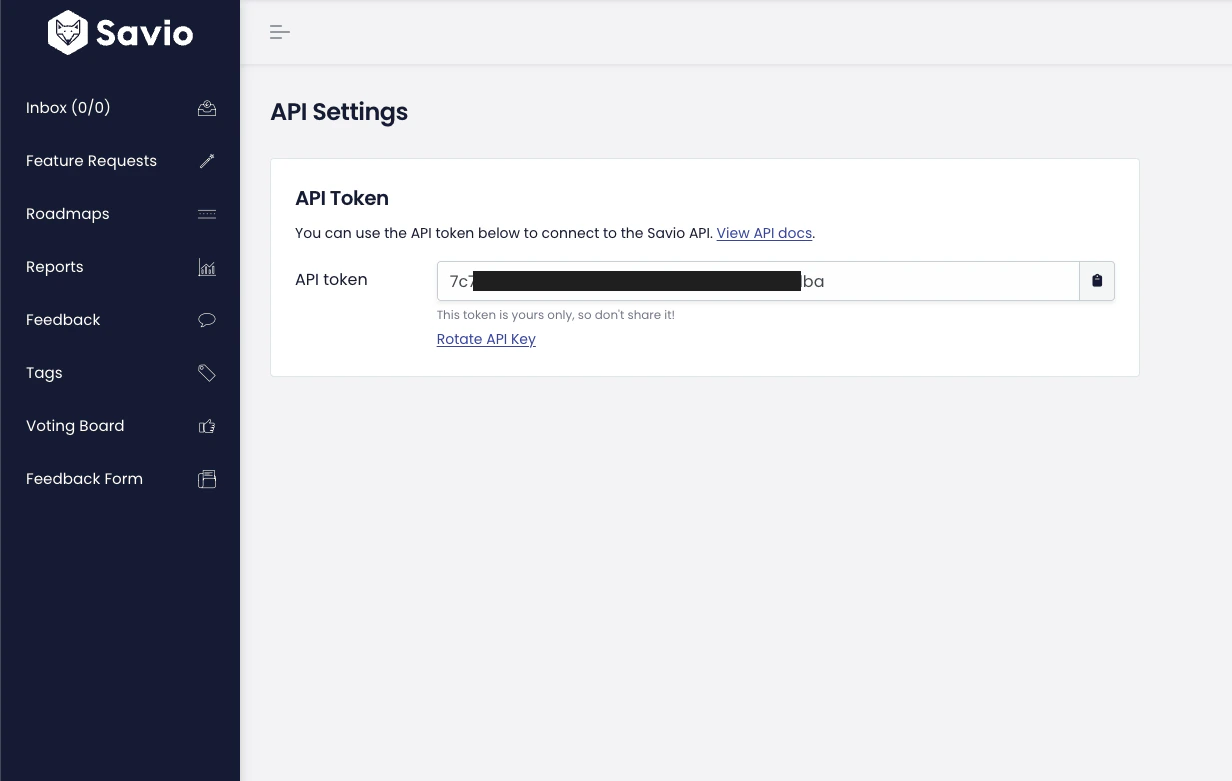
In Savio, go to **API Settings** ([direct link](https://www.savio.io/app/accounts/api-access)) and copy your API token.
 In Chartcastr, open **New Source** and select **Savio**. Paste your API token and click **Test & Connect**. Chartcastr validates the token against the Savio API before saving.
Pick from feedback / feature-request / contact / company volume charts, an activity overlay (multi-series), breakdowns by customer type or source tool, status distribution for feature requests, or top feature requests by linked-feedback count.
Pick or add a destination (Slack channel or email), set the delivery frequency, and optionally enable AI summaries.
## Available Metrics
Chartcastr ships **9 pre-built Savio metrics** across four categories.
Daily counts for feedback, feature requests, contacts, and companies over the last 30 days.
Pick any of feedback, feature requests, contacts, and companies and overlay them as lines on a single chart.
Feedback by customer type, feedback by source tool, and feature requests by status.
Top 10 feature requests by linked feedback count.
See the full list of Savio metrics with chart types and descriptions.
## Activity Overlay
The **Activity Overlay** chart renders feedback, feature requests, contacts, and companies as separate lines on the same chart. At setup, pick any combination of those four series — Chartcastr fetches each from the matching Savio endpoint and overlays them with consistent date buckets.
This is the right choice when you want a single weekly "Savio pulse" rather than four separate charts. The series you pick at setup are frozen for that source; create additional sources to compare different combinations.
## Next Steps
Deliver Savio charts to your Slack channels with AI summaries in the thread.
Schedule Savio feedback reports to any inbox or distribution list.
In Chartcastr, open **New Source** and select **Savio**. Paste your API token and click **Test & Connect**. Chartcastr validates the token against the Savio API before saving.
Pick from feedback / feature-request / contact / company volume charts, an activity overlay (multi-series), breakdowns by customer type or source tool, status distribution for feature requests, or top feature requests by linked-feedback count.
Pick or add a destination (Slack channel or email), set the delivery frequency, and optionally enable AI summaries.
## Available Metrics
Chartcastr ships **9 pre-built Savio metrics** across four categories.
Daily counts for feedback, feature requests, contacts, and companies over the last 30 days.
Pick any of feedback, feature requests, contacts, and companies and overlay them as lines on a single chart.
Feedback by customer type, feedback by source tool, and feature requests by status.
Top 10 feature requests by linked feedback count.
See the full list of Savio metrics with chart types and descriptions.
## Activity Overlay
The **Activity Overlay** chart renders feedback, feature requests, contacts, and companies as separate lines on the same chart. At setup, pick any combination of those four series — Chartcastr fetches each from the matching Savio endpoint and overlays them with consistent date buckets.
This is the right choice when you want a single weekly "Savio pulse" rather than four separate charts. The series you pick at setup are frozen for that source; create additional sources to compare different combinations.
## Next Steps
Deliver Savio charts to your Slack channels with AI summaries in the thread.
Schedule Savio feedback reports to any inbox or distribution list.